
While mortgage rates are grabbing big headlines, homeowners insurance has quietly become one of the most significant costs squeezing today’s buyers.
Over the past seven years, average premiums have climbed sharply across the country. According to the National Association of Insurance Commissioners (NAIC), the Southeast carries the highest average annual premium at $1,818, while the Northeast sits lowest at $1,396. Based on Bureau of Labor Statistics data tracked by the National Association of REALTORS® (NAR), premiums have risen 7% since the start of 2025.
Insurance experts point to climate-related risk and rising rebuilding costs as key drivers, with insurers passing much of this added risk on to consumers. Combined with a stubborn affordability crisis and inflation that has remained above the Federal Reserve’s 2% target for years, the costs are adding up. The NAR estimates that homebuying power today is roughly 10% lower than it would be had insurance costs simply kept pace with inflation.
The strain hits lower-income households the hardest. Many are dropping coverage altogether to save money, leaving their homes—typically their largest assets—exposed in the event of a disaster.
Insurers are also pulling back more aggressively, declining to renew policies when the risk no longer justifies the reward. Since 2018, nonrenewal rates have jumped nationwide, from 96% in the Southeast to as much as 216% in the West. As NAIC researchers Jeffrey Czajkowski and Paula Harms recently summarized, the market looks stable on the surface but is clearly under growing strain.
For your clients, understanding these trends can help set realistic expectations around total homeownership costs. I am more than happy to talk through how insurance costs are affecting buyers or sellers in your market.
Mortgage Rates Come Down From Long-Term Highs
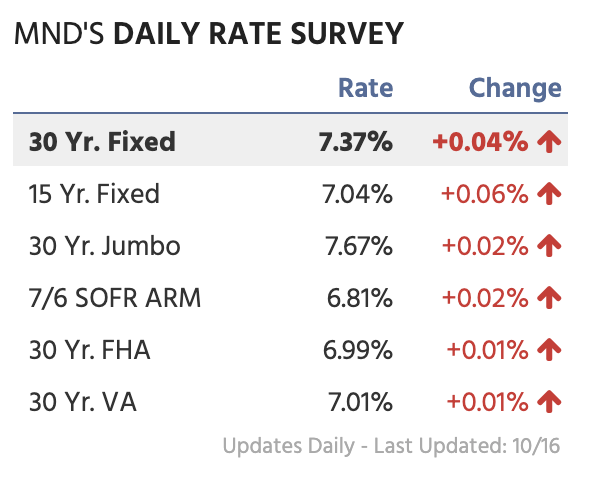
What a difference a week can make” is an expression that is used all-too-frequently in the mortgage industry. Last week delivered a seven-day stretch that certainly warranted its use.
The average top-tier 30-year fixed rate dropped to 7.33% last Thursday, more than 0.25% below the long-term highs hit just last week. The turnaround began in dramatic fashion on Wednesday. Hotter-than-expected inflation data pushed lenders’ first-rate sheets 0.1% higher, a big move for a single day. Approximately 30 minutes later, the bond market started a steady recovery as stocks sold off hard, posting their worst day in over two months. Many investors moved money out of stocks and into bonds, which helps push rates down. By the end of the day, the average lender was 0.01% lower than 24 hours earlier, an outcome that looked nearly impossible that morning.
Thursday built on this positive momentum, driven largely by growing worries in the tech sector. Concerns that trouble at certain AI-related companies, such as CoreWeave, could spread to others weighed on investor sentiment. A cooling tech sector could slow economic growth, and a souring appetite for AI-related corporate debt would mean less new debt competing with Treasuries and mortgage bonds for investor dollars.
Yields also climbed high enough to potentially attract buyers. Some investors see 10-year Treasury yields above 5.2% as an attractive entry point, much as they did when yields reached 5% in 2023.
Behind this week’s rate swings were two closely watched inflation reports, and both pointed in the same uncomfortable direction.
Inflation runs hot as both the consumer and wholesale level
Wednesday’s Consumer Price Index (CPI) showed prices rose 0.6% in September. The annual inflation rate climbed to 3.7% from 3.4% in August, slightly above the 3.6% economists forecasted. Core CPI, which strips out volatile food and energy costs, rose 0.3% for the month, topping the 0.2% estimate. Its annual rate moved up to 2.6% from 2.4%, also above the 2.5% forecast.
Once again, energy was the main culprit. The energy index jumped 5.2% and gasoline surged 9.1%, accounting for roughly half of the overall increase. Over the past year, gasoline is up 34.2% and fuel oil is up a staggering 74.2%.
However, energy was not the entire story. Food prices were flat for the month, shelter costs rose 0.4%, used car and truck prices climbed 0.7%, and apparel, a category sensitive to tariffs, increased 0.3%. A strategist at Carson Group noted that core inflation ran at a 3.7% annualized pace in September and warned that the full impact of higher diesel prices and the AI boom has yet to show up in the data.
Thursday’s Producer Price Index (PPI), which tracks what businesses pay to produce goods and services, told a similar story. Wholesale prices rose 0.6% in September, pushing the annual rate to 6.3%, the highest level since late 2022. Core PPI, which excludes food and energy, jumped 0.7% for the month and is up 5% from a year ago. All the report’s key numbers came in well above economists’ expectations.
The PPI is often seen as a preview of what’s coming for consumer prices. According to the Bureau of Labor Statistics, half of the monthly increase came from gasoline. Diesel, jet fuel, fresh and dry vegetables, residential electricity, and crude oil all rose as well.
Economists have singled out diesel as the most worrying increase, since it powers farming, trucking, and shipping, and higher costs there tend to ripple through nearly every category of consumer goods. Unlike earlier in the year, when price spikes were concentrated in fuel-exposed sectors, the increases are now spreading across the broader economy.
The two reports mean the Federal Reserve is now facing a delicate balancing act. The central bank raised its benchmark rate by a quarter point in September, taking the range to 3.75%–4%. Several officials have said there’s no need to rush another increase, though most still expect one before year’s end. Markets are leaning toward a pause in October and a hike in December, but this week’s data raised the odds of a faster move.
Existing home sales edge upward
According to the National Association of REALTORS® (NAR) Existing Home Sales report, sales rose 1.5% in September to a seasonally adjusted annual rate of 3.99 million. Monthly sales climbed in the South and West and dipped in the Northeast, while every region posted an annual decline.
NAR Chief Economist Lawrence Yun noted that August and September were the two slowest months for sales this year, with rising mortgage rates shrinking the pool of buyers who qualify.
Inventory reached 1.6 million units, a 4.8-month supply, which Yun said is giving buyers more negotiating power. The median price hit $417,500, up 1.3% from last year and the 39th straight month of annual gains. Affordability slipped from a year ago, with only the West improving.
Leave a Reply